

 3 weeks ago
4
PROTECT YOURSELF with Orgo-Life® QUANTUM TECHNOLOGY
Orgo-Life the new way to the future Advertising by Adpathway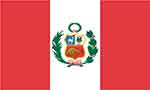 by Flagpictures.org
The Republic of Peru exported US$90.1 billion worth of products around the world in 2025. That dollar amount results from a 60.1% expansion from $56.3 billion five years earlier in 2021.
Year over year, Peruvian exports advanced by 20.6% compared to the $74.7 billion in international revenues during 2024.
Applying a continental lens, more than half (54.9%) of Peru’s exports by value was delivered to Asian countries while 18.1% was sold to importers in North America.
Peru shipped another 15.5% worth of goods to customers located in Europe.
Smaller percentages were consumed by buyers in Latin America (9.5%) excluding Mexico but including the Caribbean, Oceania (1.8%) led by Australia and New Zealand, then Africa (0.2%).
Below is a list showcasing 25 of Peru’s top trading partners, countries that imported the most Peruvian shipments by dollar value during 2025. Also shown is each import country’s percentage of total Peruvian exports.
- mainland China: US$32.6 billion (36.2% of Peru’s total exports)
- United States: $10.2 billion (11.3%)
- India: $6.5 billion (7.2%)
- Canada: $5 billion (5.6%)
- Japan: $3.2 billion (3.6%)
- United Arab Emirates: $2.9 billion (3.2%)
- Spain: $2.8 billion (3.1%)
- Netherlands: $2.7 billion (3%)
- Switzerland: $2.6 billion (2.9%)
- Chile: $2.3 billion (2.5%)
- South Korea: $2.2 billion (2.4%)
- Australia: $1.61 billion (1.8%)
- Brazil: $1.59 billion (1.8%)
- Germany: $1.4 billion (1.5%)
- Ecuador: $1.2 billion (1.3%)
- Italy: $1.17 billion (1.3%)
- Colombia: $1.13 billion (1.3%)
- Mexico: $1 billion (1.1%)
- United Kingdom: $808 million (0.9%)
- Belgium: $661.6 million (0.7%)
- Bolivia: $642.9 million (0.7%)
- France: $483.7 million (0.5%)
- Türkiye: $387.4 million (0.4%)
- Panama: $359.7 million (0.4%)
- Malaysia: $355.4 million (0.4%)
Well over nine-tenths (95.4%) of Peruvian exports in 2025 was delivered to the above 25 trade partners.
The leading growth markets for Peru were Australia (up 1,704% from 2024), Germany (up 51.4%), United Arab Emirates (up 48.9%), India (up 38.4%), Italy (up 37.9%) and Spain (up 34.1%).
Recording percentage decreases for their purchases of Peruvian exports were buyers in Panama (down -44.1% from 2024), United Kingdom (down -5.2%), Japan (down -3.7%), Brazil (down -3.4%) and Switzerland (down -1.1%).
Countries Causing Peru’s Worst Trade Deficits
As defined by Investopedia, a country whose total value of all imported goods is higher than its value of all exports is said to have a negative trade balance or deficit.
It would be unrealistic for any exporting nation to expect across-the-board positive trade balances with all its importing partners.
Peru incurred the highest trade deficits with the following countries.
- Argentina: -US$2.7 billion (country-specific trade deficit in 2025)
- Brazil: -$1.9 billion
- Colombia: -$933 million
- Vietnam: -$754 million
- United States: -$742.9 million
- Mexico: -$630.7 million
- Nigeria: -$614.2 million
- Thailand: -$543.6 million
- Indonesia: -$459.1 million
- Trinidad/Tobago: -$337.6 million
Among Peru’s trading partners that cause the greatest negative trade balances, Peruvian deficits with Trinidad and Tobago (up 77.6%), Colombia (up 67.7%) and the United States of America (up 58.6%) grew at the fastest pace from 2024 to 2025.
These cashflow deficiencies clearly indicate Peru’s competitive disadvantages with the above countries, but also represent key opportunities for Peru to develop country-specific strategies to strengthen its overall position in international trade.
Countries Generating Peru’s Largest Trade Surpluses
Overall, Peru recorded a US$29.1 billion trade surplus in 2025, expanding by 48.3% from $19.6 billion in black ink for 2024.
Based on Investopedia’s definition of net importer, a country whose total value of all imported goods is lower than its value of all exports is said to have a positive trade balance or surplus.
Peru incurred the highest trade surpluses with the following countries.
- mainland China: US$13.6 billion (country-specific trade surplus in 2025)
- India: $5.1 billion
- Canada: $3.8 billion
- United Arab Emirates: $2.8 billion
- Switzerland: $2.42 billion
- Netherlands: $2.41 billion
- Japan: $2 billion
- Spain: $1.9 billion
- Australia: $1.5 billion
- South Korea: $1.4 billion
Among Peru’s trading partners that generate the greatest positive trade balances, Peruvian surpluses with Canada (up 61.4%), United Arab Emirates (up 49.8%) and Spain (up 49.8%) grew at the fastest pace from 2024 to 2025.
In addition, Peru transitioned from a -$96.8 million deficit trading with Australia to posting the billion-dollar surplus listed above.
These positive cashflow streams clearly indicate Peru’s competitive advantages with the above countries, but also represent key opportunities for Peru to develop country-specific strategies to optimize its overall position in international trade.
Companies Servicing Peruvian Trading Partners
Peru has only one company on Forbes Global 2000 rankings, a regional bank named Credicorp.
Wikipedia lists the following the following Peruvian companies, which are involved in global trade.
- Backus and Johnston (brewery)
- Coporación Aceros Arequipa (steel products)
- Ferreyros (industrial, construction machinery)
- Maple Energy (oil)
- Peru LNG (natural gas)
- Petroperú (petroleum)
See also Peru’s Top 10 Exports, China’s Top Trading Partners, Top US Trading Partners, South Korea’s Top Trading Partners and Canada’s Top Trading Partners
Research Sources:
Central Intelligence Agency, The World Factbook Country Profiles. Accessed on September 25, 2025
Forbes Global 2000 rankings, The World’s Biggest Public Companies. Accessed on September 25, 2025
International Trade Centre, Trade Map. Accessed on September 25, 2025
Investopedia, Net Exports Definition. Accessed on September 25, 2025
Wikipedia, Peru. Accessed on September 25, 2025


















 English (US) ·
 French (CA) ·
 French (FR) ·