

 4 weeks ago
7
PROTECT YOURSELF with Orgo-Life® QUANTUM TECHNOLOGY
Orgo-Life the new way to the future Advertising by Adpathway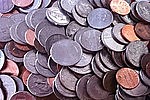 Nickel in coins
International purchases of imported nickel totaled US$5.1 billion in 2025.
The overall value of nickel imports for all importing countries slowed by an average -13.9% compared to 5 years earlier in 2021 when nickel purchases were valued at $5.9 billion.
Year over year, worldwide spending on imported nickel accelerated by 14.9% starting from $4.4 billion for 2024.
Shiny and silvery-white in color with a slight golden tinge, nickel is a hard but pliable metal that can be formed into wires.
Nickel is mainly used to create stainless steel but also nonferrous alloys, electroplating and alloy steel. Consumer products comprised partly of nickel include magnets, coins, rechargeable batteries, electric guitar strings, and plaiting for plumbing fixtures since nickel helps prevent corrosion.
Key Geographic Insights for Nickel Imports
The biggest 5 spenders on imported nickel are mainland China, Indonesia, Canada, Finland and the sub-Saharan African nation Namibia. Altogether, that quintet of major nickel importers is responsible for 93.8% of the world’s total purchases of imported nickel during 2025.
Such a high percentage indicates an intensely concentrated subset of major import customers. In fact, there were just 41 countries that imported nickel in the latest reporting period.
From a continental perspective, Asian countries bought the highest dollar worth of nickel imported from foreign markets with purchases costing a total $4.1 billion or 81% of the worldwide total. In second place were nickel importers based in North America at 7.1% with another 6.6% going to Europe.
Smaller percentages were sold to buyers in Africa (5.2%), Australia in Oceania (0.07%) then customers in Latin America (0.04%) excluding Mexico but including the Caribbean.
For research purposes, the 4-digit Harmonized Tariff System code prefix is 2604 for nickel ores and concentrates.
Below are the 15 countries that imported the highest dollar value worth of nickel during 2025.
- mainland China: US$3.1 billion (60.7% of total nickel imports)
- Indonesia: $747.3 million (14.8%)
- Canada: $357.3 million (7.1%)
- Finland: $312.2 million (6.2%)
- Namibia: $261.2 million (5.2%)
- South Korea: $205.5 million (4.1%)
- Japan: $56 million (1.1%)
- Malaysia: $15.2 million (0.3%)
- Belgium: $8.3 million (0.2%)
- Spain: $6 million (0.1%)
- Germany: $3.9 million (0.1%)
- Australia: $3.7 million (0.1%)
- United Arab Emirates: $3.7 million (0.1%)
- South Africa: $2.3 million (0.05%)
- Brazil: $1.8 million (0.04%)
By value, the listed 15 countries purchased 99.9% of all nickel imported in 2025.
Among the above countries, the fastest-growing markets for nickel from 2024 to 2025 were: Indonesia (up 62.4%), Japan (up 44.9%), Belgium (up 32.3%) and South Africa (up 19.8%).
Major buyers that posted year-over-year declines in their imported nickel purchases were: Malaysia (down -42.2%), Brazil (down -28.9%) and South Korea (down -1.8%).
Nickel Imported into China
Below are the top suppliers from which mainland China imported the highest dollar value worth of nickel during 2025. Within parenthesis is the percentage change in value for each supplying country.
- Philippines: US$1.8 billion (up 13.5% from 2024)
- Russia: $287.2 million (down -13.8%)
- Australia: $277 million (up 61.1%)
- Ivory Coast: $125.4 million (down -3.3%)
- New Caledonia: $119.6 million (up 9.6%)
- Zambia: $117.3 million (up 12.1%)
- Guatemala: $90.8 million (up 159.3%)
- Brazil: $85.7 million (down -4.5%)
- Vietnam: $74.7 million (up 7.8%)
- Solomon Islands: $47.1 million (up 22.7%)
- Tanzania: $18.4 million (up 47.7%)
- Canada: $1.2 million (up 153.7%)
- Pakistan: $92,000 (2024 data unavailable)
- Ethiopia: $89,000 (2024 data unavailable)
- Malaysia: $9,000 (2024 data unavailable)
By value, the listed 15 countries shipped 99.9996% of nickel imported by mainland China in 2025.
Among the above countries, the fastest-growing suppliers of nickel to China from 2024 to 2025 were: Guatemala (up 159.3%), Canada (up 153.7%), Australia (up 61.1%) and Tanzania (up 47.7%).
Countries that experienced year-over-year declines in the value of their nickel supplied to Chinese importers were: Russia (down -13.8%), Brazil (down -4.5%) and Africa’s Ivory Coast (down -3.3%).
Overall, the value of China’s imported nickel rose by an average 13.6% from all supplying countries since 2024 when nickel purchased cost $2.7 billion.
Nickel Imported into Indonesia
Below are the top suppliers from which Indonesia imported the highest dollar value worth of nickel during 2025. Within parenthesis is the percentage change in value for each supplying country.
- Philippines: US$725.2 million (up 62.9% from 2024)
- Solomon Islands: $12.2 million (2024 data unavailable)
- mainland China: $9.5 million (down -17.2%)
- Taiwan: $291,000 (down -91.1%)
- United States: $151,000 (up 297.4%)
- Brazil: $10,000 (up 400%)
- Australia: $7,000 (down -53.3%)
By value, the listed countries shipped 100% of nickel imported by Indonesia in 2025.
Among the above countries, growth suppliers of nickel to Indonesia from 2024 to 2025 were: Brazil (up 400%), United States of America (up 297.4%) and the Philippines (up 62.9%).
Overall, the value of Indonesia’s imported nickel accelerated by an average 62.4% from all supplying countries since 2024 when nickel purchased cost $460.2 million.
Nickel Imported into Canada
Below are the top suppliers from which Canada imported the highest dollar value worth of nickel during 2025. Within parenthesis is the percentage change in value for each supplying country.
- United States: US$148.2 million (up 22.1% from 2024)
- Finland: $67.2 million (down -20.9%)
- Switzerland: $50.7 million (up 80.2%)
- Brazil: $47.9 million (up 30.6%)
- Zambia: $42 million (down -41%)
- South Africa: $1.4 million (2024 data unavailable)
- Italy: $1,000 (2024 data unavailable)
By value, the listed countries shipped 100% of nickel imported by Canada in 2025.
Among the above countries, growth suppliers of nickel to Canada from 2024 to 2025 were: Switzerland (up 80.2%), Brazil (up 30.6%) and the United States of America (up 22.1%).
Overall, the value of Canada’s imported nickel grew by an average 4.4% from all supplying countries since 2024 when nickel purchased cost $342.3 million.
Nickel Imported into Finland
Below are the top suppliers from which Finland imported the highest dollar value worth of nickel during 2025. Within parenthesis is the percentage change in value for each supplying country.
- Canada: US$140.7 million (up 33.3% from 2024)
- Brazil: $102.8 million (up 43.6%)
- Zambia: $40.2 million (down -31.8%)
- South Africa: $25.5 million (down -53.8%)
- Norway: $2.3 million (up 25.3%)
- United States: $457,000 (2024 data unavailable)
- United Kingdom: $376,000 (2024 data unavailable)
By value, the listed countries shipped 100% of nickel imported by Finland in 2025.
Among the above countries, growth suppliers of nickel to Finland from 2024 to 2025 were: Brazil (up 43.6%), Canada (up 33.3%) and Norway (up 25.3%).
Overall, the value of Finland’s imported nickel went up by an average 6.3% from all supplying countries since 2024 when nickel purchased cost $293.6 million.
Top Nickel Importers Ranked by Shipment Weight
Worldwide imports of nickel totaled 62 million tons in 2025, up by 17.1% from 53 million tons in 2021.
The shipment weight of globally imported nickel advanced by 18.5% from 52.3 million tons during 2024.
- mainland China: 42,263,232 tons (up 11% from 2024)
- Indonesia: 15,841,014 tons (up 51.2%)
- South Korea: 2,752,457 tons (up 2.2%)
- Japan: 750,915 tons (up 27.4%)
- Finland: 199,314 tons (up 6.8%)
- Namibia: 143,739 tons (up 3.6%)
- Canada: 36,611 tons (down -24.3%)
- Australia: 6,172 tons (up 132.2%)
- Belgium: 5,066 tons (up 50.7%)
- Malaysia: 4,839 tons (down -70.3%)
- United Arab Emirates: 2,085 tons (2024 data unavailable)
- Saudi Arabia: 1,675 tons (up 49.3%)
- South Africa: 1,582 tons (up 2.3%)
- Germany: 1,480 tons (up 34.3%)
- Singapore: 823 tons (up 32.5%)
By shipment weight for nickel, the strongest percentage gainers from 2024 to 2025 were importers located in Australia (up 132.2%), Indonesia (up 51.2%), Belgium (up 50.7%), Saudi Arabia (up 49.3%) then Germany (up 34.3%).
Double-digit percentage decliners year over year were buyers in Malaysia (down -70.3% from 2024) and Canada (down -24.3%).
Average Prices for Nickel by Major Import Country
In 2025, the world’s overall average unit price paid for imported nickel was US$82 per ton.
That average price per ton deflated by -26.1% compared to the average $111 per ton in 2021. On an annual basis, the average price for 2025 declined by -2.4% versus the $84 per ton for globally imported nickel during 2024.
Listed below are the average unit prices paid by the 15 top importers nickel ranked by tonnage of nickel bought in 2025.
- mainland China: US$73 per ton (up 2.8% from 2024)
- Indonesia: $47 per ton (up 6.8%)
- Canada: $9,759 per ton (up 38%)
- Finland: $1,567 per ton (down -0.4%)
- Namibia: $1,817 per ton (up 4.8%)
- South Korea: $75 per ton (down -3.8%)
- Japan: $75 per ton (up 13.6%)
- Malaysia: $3,138 per ton (up 94.4%)
- Belgium: $1,639 per ton (down -12.2%)
- Germany: $2,653 per ton (down -18.6%)
- Australia: $603 per ton (down -51.3%)
- United Arab Emirates: $1,765 per ton (2024 data unavailable)
- South Africa: $1,471 per ton (up 17%)
- Brazil: $3,991 per ton (down -6.4%)
- Netherlands: $1,411 per ton (2024 data unavailable)
The lowest average unit prices per ton were paid by importers in Indonesia, mainland China, Japan, South Korea and Australia.
Highest average prices were paid by nickel importers in Canada, Brazil, Malaysia, Germany and Namibia.
See also Top Nickel Exporters by Country, Top Tin Exporters, Copper Ore Exports by Country and China’s Top Trading Partners
Research Sources:
Central Intelligence Agency, The World Factbook Field Listing: Imports – Commodities. Accessed on September 21, 2026
International Trade Centre, Trade Map. Accessed on September 21, 2026
Wikipedia, Nickel. Accessed on September 21, 2026

















 English (US) ·
 French (CA) ·
 French (FR) ·