

 2 days ago
2
PROTECT YOURSELF with Orgo-Life® QUANTUM TECHNOLOGY
Orgo-Life the new way to the future Advertising by Adpathway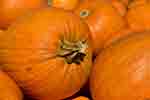 Pumpkin display (Pixabay)
International purchases of imported pumpkins cost a total US$1.73 billion in 2025.
The overall cost of pumpkin imports rose by 7.2% for all importing countries since 2021 when international purchases of pumpkins were valued at $1.61 billion.
Year over year, imports of pumpkins decelerated via an -8.9% slowdown compared to $1.9 billion starting from 2024.
The top 5 imported pumpkin buyers are the United States of America and 4 major European importers namely Germany, France, United Kingdom and the Netherlands. Collectively, that quintet of leading pumpkin markets generated 61.9% of total pumpkins imported in 2025.
From a continental perspective, importers in European countries bought three-fifths (60%) of spending on imported pumpkins during 2025 with purchases totaling $1.04 billion. In second place were importers located in North America at 30.7% while 8.6% of pumpkins imported worldwide was delivered to customers in Asia.
Tinier percentages arrived in Latin America (0.31%) excluding Mexico but including the Caribbean, Africa (0.27%) and Oceania (0.11%) mostly New Zealand.
For research purposes, the 6-digit Harmonized Tariff System code prefix is 070993 for fresh or chilled pumpkins and similar squash and gourds.
Below are the 15 countries that spent the most on imported pumpkins during 2025.
- United States: US$464.5 million (26.9% of total imported pumpkins)
- Germany: $206.3 million (11.9%)
- France: $201.8 million (11.7%)
- United Kingdom: $109.3 million (6.3%)
- Netherlands: $87.2 million (5%)
- Canada: $62.8 million (3.6%)
- Japan: $54.7 million (3.2%)
- Italy: $45.6 million (2.6%)
- Belgium: $42 million (2.4%)
- Austria: $41.9 million (2.4%)
- Poland: $37.7 million (2.2%)
- Switzerland: $35.9 million (2.1%)
- Russia: $35.7 million (2.1%)
- Spain: $30.1 million (1.7%)
- Singapore: $24.6 million (1.4%)
By value, the listed 15 countries purchased 85.7% of all pumpkins imported in 2025.
Among the above countries, the fastest-growing markets for pumpkins since 2021 were: Switzerland (up 418.9%), Poland (up 23.9%), Italy (up 19.1%) and the United Kingdom (up 17.2%).
Listed buyer countries that posted 5-year declines in their imported pumpkins purchases were: Japan (down -34.2%), Russia (down -25.3%) and the Netherlands (down -1.9%).
Pumpkins Imported into the United States
America’s global purchases of imported pumpkins totaled US$464.5 million in 2025. Below are the top 15 suppliers from which the US imported the highest dollar value worth of pumpkins during 2025. Within parenthesis is the percentage change in value for each supplying country since 2021.
- Mexico: US$413.5 million (up 11.5% from 2021)
- Canada: $24.8 million (up 14.4%)
- Costa Rica: $12.3 million (up 28.8%)
- Honduras: $3.9 million (down -22.2%)
- Panama: $3.7 million (up 89.6%)
- Guatemala: $3.3 million (up 34.4%)
- Dominican Republic: $2.8 million (down -11.3%)
- Spain: $128,000 (up 2033.3%)
- Haiti: $38,000 (down -42.4%)
- Argentina: $26,000 (2024 data unavailable)
- Trinidad/ Tobago: $23,000 (2024 data unavailable)
- Italy: $17,000 (2024 data unavailable)
- United Kingdom: $12,000 (2024 data unavailable)
- mainland China: $9,000 (2024 data unavailable)
- Ecuador: $4,000 (down -33.3%)
By value, the listed 15 countries shipped 99.994% of pumpkins imported by the United States of America in 2025.
Among the above countries, the fastest-growing suppliers of pumpkins to the United States since 2021 were: Spain (up 2,033%), Panama (up 89.6%), Guatemala (up 34.4%) and Costa Rica (up 28.8%).
Countries that experienced declines in the value of their pumpkins supplied to American importers included: Haiti (down -42.4%), Ecuador (down -33.3%), Honduras (down -22.2%) and Dominican Republic (down -11.3%).
Overall, the value of America’s imported pumpkins rose by an average 11.9% from all supplying countries since 2021 when pumpkins purchased cost $415 million.
Pumpkins Imported into Germany
Germany’s global purchases of imported pumpkins totaled US$206.3 million in 2025. Below are the top 15 suppliers from which Germany imported the highest dollar value worth of pumpkins during 2025. Within parenthesis is the percentage change in value for each supplying country since 2021.
- Spain: US$121.9 million (down -5.1% from 2021)
- Netherlands: $39.2 million (up 68.2%)
- Italy: $10.1 million (down -26.1%)
- Morocco: $7.4 million (up 18.6%)
- Türkiye: $6.3 million (up 54.5%)
- South Africa: $5.5 million (up 31.6%)
- Belgium: $2.7 million (up 42.1%)
- Egypt: $1.8 million (up 125.7%)
- Syria: $1.5 million (up 5,996%)
- India: $1.11 million (up 271.8%)
- New Zealand: $1.09 million (down -41.2%)
- Portugal: $1.05 million (down -49.2%)
- Poland: $920,000 (up 54.6%)
- France: $908,000 (down -77.9%)
- Argentina: $889,000 (up 41.3%)
By value, the listed 15 countries shipped 98.1% of pumpkins imported by Germany in 2025.
Among the above countries, the fastest-growing suppliers of pumpkins to Germany since 2021 were: Syrian Arab Republic (up 5,996%), India (up 271.8%), Egypt (up 125.7%) and the Netherlands (up 68.2%).
Countries that experienced declines in the value of their pumpkins supplied to German importers included: France (down -77.9%), Portugal (down -49.2%), New Zealand (down -41.2%) and Italy (down -26.1%).
Overall, the value of Germany’s imported pumpkins increased by an average 5.8% from all supplying countries since 2021 when pumpkins purchased cost $194.9 million.
Pumpkins Imported into France
France’s global purchases of imported pumpkins totaled US$201.8 million in 2025. Below are the top 15 suppliers from which France imported the highest dollar value worth of pumpkins during 2025. Within parenthesis is the percentage change in value for each supplying country since 2021.
- Spain: US$158.3 million (up 7.8% from 2021)
- Morocco: $23.7 million (down -20.2%)
- Italy: $7.2 million (down -23.8%)
- Portugal: $3.7 million (up 28.2%)
- Netherlands: $2 million (up 24.5%)
- Belgium: $1.8 million (down -0.3%)
- France: $975,000 (up 269.3%)
- Senegal: $814,000 (up 84.6%)
- South Africa: $553,000 (up 19.2%)
- Costa Rica: $479,000 (up 73.6%)
- Germany: $365,000 (up 12.3%)
- India: $312,000 (up 7,700%)
- Poland: $209,000 (up 15.5%)
- Peru: $187,000 (up 567.9%)
- Bangladesh: $149,000 (up 22.1%)
By value, the listed 15 countries shipped 99.4% of pumpkins imported by France in 2025.
Among the above countries, the fastest-growing suppliers of pumpkins to France since 2021 were: India (up 7,700%), Peru (up 567.9%), France (up 269.3%) and Senegal (up 84.6%).
Countries that experienced declines in the value of their pumpkins supplied to French importers were: Italy (down -23.8%), Morocco (down -20.2%) and Belgium (down -0.3%).
Overall, the value of France’s imported pumpkins gained an average 3.4% from all supplying countries since 2021 when pumpkins purchased cost $195.3 million.
Pumpkins Imported into the United Kingdom
The United Kingdom’s global purchases of imported pumpkins totaled US$109.3 million in 2025. Below are the top 15 suppliers from which the UK imported the highest dollar value worth of pumpkins during 2025. Within parenthesis is the percentage change in value for each supplying country since 2021.
- Spain: US$64.6 million (up 26.1% from 2021)
- Morocco: $8.9 million (up 72.5%)
- South Africa: $6.9 million (down -13%)
- Portugal: $5.2 million (up 37.5%)
- Italy: $4.2 million (up 143.3%)
- Pakistan: $2.1 million (up 1.6%)
- Türkiye: $2 million (up 55.8%)
- Netherlands: $1.6 million (down -78.7%)
- France: $1.25 million (up 19.4%)
- India: $1.17 million (up 174.9%)
- Argentina: $1.09 million (down -23.2%)
- Ireland: $1.06 million (up 261.2%)
- Costa Rica: $1.04 million (down -4.9%)
- Jordan: $1.02 million (up 657.8%)
- Belgium: $1 million (up 221.9%)
By value, the listed 15 countries shipped 94.3% of pumpkins imported by the United Kingdom in 2025.
Among the above countries, the fastest-growing suppliers of pumpkins to the UK since 2021 were: Jordan (up 657.8%), Ireland (up 261.2%), Belgium (up 221.9%) and India (up 174.9%).
Countries that experienced declines in the value of their pumpkins supplied to UK importers were: Netherlands (down -78.7%), Argentina (down -23.2%), South Africa (down -13%) and Costa Rica (down -4.9%).
Overall, the value of the United Kingdom’s imported pumpkins inflated by an average 17.2% from all supplying countries since 2021 when pumpkins purchased cost $93.2 million.
See also Pumpkin Exports by Country, Bananas Imports by Country and Sugar Imports by Country
Research Sources:
Central Intelligence Agency, The World Factbook Field Listing: Imports – Commodities. Accessed on October 19, 2026
International Trade Centre, Trade Map. Accessed on October 19, 2026
Investopedia, Net Exports Definition. Accessed on October 19, 2026

















 English (US) ·
 French (CA) ·
 French (FR) ·