

 2 weeks ago
4
PROTECT YOURSELF with Orgo-Life® QUANTUM TECHNOLOGY
Orgo-Life the new way to the future Advertising by Adpathway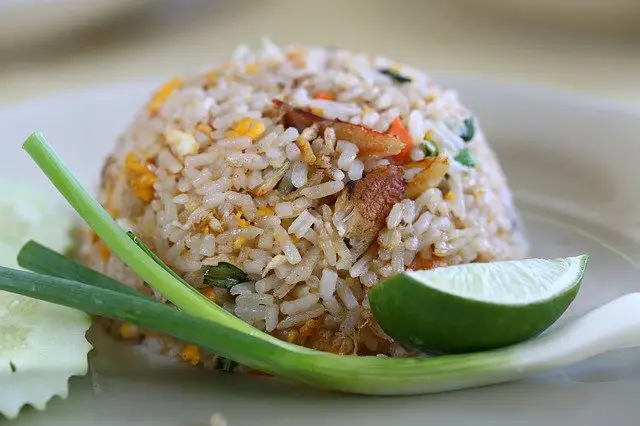 Fried rice
Globally exported rice amounted to an overall 61.9 million tons during 2025. That quantity reflects a 15.7% increase in shipment weight since 2021 and a 2.3% expansion since 2024.
The world’s top 6 exporters of rice by total weight are India, Thailand, Vietnam, Cambodia, Pakistan then the United States of America. Combined, those leading suppliers by volume sold 49.2 million tons of rice during 2025 or 79.4% of global shipments by weight.
One of the issues that this analysis focuses on is whether higher volumes of rice exports correspond with lower average unit prices due to economies of scale.
Top Rice Export Countries by Shipment Weight
The top exporters of rice as measured by tonnage are listed below. Based on that weight metric, these 50 key suppliers of rice on international markets accounted for 99.74% of the world’s rice exports in 2025.
| Rice ExporterTons2024-52021-5 | ||||
| 1 | India | 21,841,919 | +21.8% | +2.6% |
| 2 | Thailand | 7,879,516 | -20.4% | +29.7% |
| 3 | Vietnam | 6,173,961 | +36.5% | +8.1% |
| 4 | Cambodia | 5,690,791 | +0.5% | +794.5% |
| 5 | Pakistan | 4,598,535 | -29.9% | +15.4% |
| 6 | United States | 2,980,316 | -22.2% | -11.8% |
| 7 | Myanmar | 2,239,557 | -18.9% | +32.9% |
| 8 | mainland China | 1,760,269 | +53.8% | -28.1% |
| 9 | Brazil | 1,282,403 | +19.3% | +50.1% |
| 10 | Uruguay | 1,163,761 | +41.1% | +52.9% |
| 11 | Paraguay | 1,023,607 | +33.1% | +47.7% |
| 12 | Italy | 665,981 | -4.9% | -7.1% |
| 13 | Guyana | 515,363 | +4.9% | +14.5% |
| 14 | Belgium | 462,389 | -6.3% | +3.5% |
| 15 | Argentina | 356,207 | +105.9% | -9.1% |
| 16 | Australia | 261,344 | +1.5% | +205.9% |
| 17 | Singapore | 243,750 | +29.6% | +60.1% |
| 18 | Türkiye | 228,558 | -21.9% | -5.3% |
| 19 | Spain | 209,790 | +37.7% | 0% |
| 20 | South Africa | 191,361 | +26.4% | +56.8% |
| 21 | South Korea | 190,795 | +38.7% | +263.9% |
| 22 | Malaysia | 134,283 | +29.5% | +38.9% |
| 23 | Kazakhstan | 131,277 | +25.8% | +6.5% |
| 24 | Greece | 127,037 | +11.1% | -8.8% |
| 25 | Taiwan | 127,033 | -9.4% | -34% |
| 26 | Tanzania | 123,572 | -68.9% | -80.1% |
| 27 | Portugal | 114,399 | +15.5% | +18.3% |
| 28 | Rwanda | 94,872 | +11.1% | +46.6% |
| 29 | Colombia | 88,018 | +41.6% | +6809% |
| 30 | United Arab Emirates | 83,416 | +327.7% | +41.1% |
| 31 | Senegal | 73,563 | -11.2% | -23.7% |
| 32 | Egypt | 71,646 | -6.7% | +2932% |
| 33 | Bulgaria | 69,905 | -0.5% | -19.2% |
| 34 | Ecuador | 52,893 | -16.8% | +142.2% |
| 35 | Poland | 51,382 | +1.9% | +33.7% |
| 36 | Germany | 51,181 | +18% | +1.5% |
| 37 | Laos | 47,790 | -41.6% | -49% |
| 38 | France | 46,667 | -8.9% | -0.2% |
| 39 | Japan | 46,573 | +3.2% | +8% |
| 40 | Suriname | 30,756 | -41.5% | -54.5% |
| 41 | Czech Republic | 29,602 | +12.8% | +28.1% |
| 42 | Canada | 28,365 | -6.1% | +61.3% |
| 43 | United Kingdom | 27,480 | -12.1% | +0.7% |
| 44 | Russia | 27,381 | +85% | -79.3% |
| 45 | Honduras | 26,594 | +42.1% | +596.9% |
| 46 | Costa Rica | 21,360 | -14.8% | +9.4% |
| 47 | El Salvador | 20,424 | +11.4% | +454.4% |
| 48 | Lithuania | 18,830 | +23.7% | +126.3% |
| 49 | Togo | 14,318 | -5.3% | +976.5% |
| 50 | Romania | 14,183 | -26.1% | -32% |
By shipment weight, the fastest-growing exporters of rice from 2024 to 2025 were the United Arab Emirates (up 327.7%), Argentina (up 105.9%), Russia (up 85%), mainland China (up 53.8%), Honduras (up 42.1%), Colombia (up 41.6%) and Uruguay (up 41.1%).
Posting the severest declines in tons of exported rice from year to year were Tanzania (down -68.9% from 2024), Laos (down -41.6%), Suriname (down -41.5%), Pakistan (down -29.9%), Romania (down -26.1%), United States of America (down -22.2%) and Türkiye (down -21.9%).
Searchable List of Average Unit Prices for Exported Rice
Overall, the world’s average unit price per ton of exported rice was US$1,150 for 2025 inflating by 7.5% from 2024 and by 23.9% over the 5 years starting in 2021.
The automated table below enables you to compare the average unit prices for exported rice for 50 of the world’s biggest exporters of rice by weight. Amounts shown are in US dollars.
You can change the presentation order by clicking the triangle icon at the top of any of the columns in the data table.
The right-most columns highlight the change in unit price for each supplier’s globally exported rice in 2025 compared to 2024 or 5 years earlier in 2021. (A value of 0% in those column means data for that year was unavailable.)
| Rice ExporterAvg Price2024-52021-5 | ||||
| 1 | India | $551 | -16.5% | +21.9% |
| 2 | Thailand | $571 | -11.3% | +3.4% |
| 3 | Vietnam | $502 | -57% | -4.6% |
| 4 | Pakistan | $526 | -17.8% | -3% |
| 5 | United States | $639 | +0.3% | +11.9% |
| 6 | Cambodia | $274 | -18% | -58.8% |
| 7 | mainland China | $560 | -17.5% | +32.4% |
| 8 | Myanmar | $422 | -13.3% | +6% |
| 9 | Italy | $1,398 | +4.3% | +37.7% |
| 10 | Uruguay | $462 | -31.7% | -8.2% |
| 11 | Belgium | $1,099 | +6% | +21% |
| 12 | Brazil | $357 | -31.6% | -15% |
| 13 | Netherlands | $1,419 | -100% | -100% |
| 14 | Paraguay | $356 | -37.9% | -9.9% |
| 15 | Guyana | $517 | -11.2% | +11.9% |
| 16 | Australia | $950 | -0.8% | -13.3% |
| 17 | Spain | $988 | -11.9% | 0% |
| 18 | Argentina | $533 | -26.3% | +7.2% |
| 19 | Türkiye | $709 | -1.1% | +32.3% |
| 20 | Portugal | $999 | +0.6% | +32.1% |
| 21 | Singapore | $459 | -21% | +5.3% |
| 22 | South Africa | $547 | -23.6% | -18.8% |
| 23 | Taiwan | $820 | +13.4% | +52.4% |
| 24 | Japan | $1,993 | +13% | +35.6% |
| 25 | Greece | $719 | +0.3% | +33.9% |
| 26 | South Korea | $452 | -4.8% | +5.1% |
| 27 | Germany | $1,635 | -5.9% | +11.1% |
| 28 | Egypt | $1,101 | -4% | +33.5% |
| 29 | Tanzania | $626 | +23.7% | +29.1% |
| 30 | Poland | $1,405 | -0.6% | +18.4% |
| 31 | Malaysia | $485 | -16.8% | +20% |
| 32 | France | $1,334 | +11% | +28.5% |
| 33 | United Kingdom | $2,002 | +2.1% | +24% |
| 34 | Bulgaria | $780 | -8.3% | +46.1% |
| 35 | Rwanda | $573 | -11.7% | +1.8% |
| 36 | Kazakhstan | $326 | -16.2% | +3.8% |
| 37 | United Arab Emirates | $496 | -58.7% | -46.3% |
| 38 | Canada | $1,386 | -12.6% | +6.9% |
| 39 | Czech Republic | $1,307 | +2.3% | +14.5% |
| 40 | Senegal | $462 | -4.9% | +4.1% |
| 41 | Colombia | $368 | -10.5% | -53.2% |
| 42 | Ecuador | $593 | -21.4% | +15.8% |
| 43 | Laos | $622 | -24.5% | +65.4% |
| 44 | Lithuania | $1,112 | +1.1% | +19.7% |
| 45 | El Salvador | $956 | +8.6% | +33% |
| 46 | Russia | $604 | -26.3% | +11.6% |
| 47 | Suriname | $533 | -7% | +11% |
| 48 | Romania | $1,129 | +17.6% | +36.7% |
| 49 | Denmark | $2,168 | 0% | +37.5% |
| 50 | Bangladesh | $1,519 | +7.7% | +17.5% |
The lowest average unit prices for exported rice per ton belong to sellers in Cambodia, Kazakhstan, Paraguay, Brazil, Colombia, Myanmar then South Korea. Other low-cost rice suppliers to global markets include Singapore, Senegal, Uruguay and Malaysia.
The fastest growers in average unit prices from 2024 to 2025 were Tanzania (up 23.7%), Romania (up 17.6%), Taiwan (up 13.4%), Japan (up 13%), France (up 11%) and El Salvador (up 8.6%).
Year over year, the greatest reductions in average unit prices collected for exported rice by ton were recorded by international suppliers in the United Arab Emirates (down -58.7% from 2024), Vietnam (down -57%), Paraguay (down -37.9%), Uruguay (down -31.7%) then Brazil (down -31.6%).
Average Unit Prices for Top 10 Rice Exporters
Below are the 10 major exporters of rice by weight, showcasing each country’s corresponding average unit price per ton of globally exported rice in US dollars. These key suppliers sold 86.9% of overall rice exports by weight in 2025 and are listed in descending rank starting with the biggest rice exporters.
- India: US$551 per ton in 2025 (down -16.5% from 2024)
- Thailand: $571 (down -11.3%)
- Vietnam: $502 (down -57%)
- Cambodia: $274 (down -18%)
- Pakistan: $526 (down -17.8%)
- United States: $639 (up 0.3%)
- Myanmar: $422 (down -13.3%)
- mainland China: $560 (down -17.5%)
- Brazil: $357 (down -31.6%)
- Uruguay: $462 (down -31.7%)
All the top 10 rice suppliers by weight charged a comparatively lower average unit price well below the global average of $1,152 per ton for all rice exporters.
That data suggests that economies of scale for the world’s 10 biggest exporters of rice may lead to the lowest average unit prices specific to rice exporting countries, but not necessarily.
Major Rice Importing Countries by Quantity
Turning attention to countries that buy rice on international markets, the top 10 rice importers below accounted for 41.9% of globally imported rice by weight during 2025.
- Vietnam: 5.4 million tons (8.6% of global rice imports)
- Philippines: 3.5 million tons (5.6%)
- mainland China: 3.1 million tons (4.9%)
- Benin: 2.5 million tons (3.9%)
- Samoa: 2.4 million tons (3.8%)
- Iraq: 2.2 million tons (3.5%)
- Ivory Coast: 2 million tons (3.2%)
- Saudi Arabia: 1.76 million tons (2.8%)
- Bangladesh: 1.75 million tons (2.8%)
- Uganda: 1.7 million tons (2.7%)
Three among the 10 biggest importing countries by imported rice volume are highly populated Asian nations including Vietnam, Philippines and Indonesia. That trio is geographically close to some of the lowest-cost rice exporters on that same continent.
See also Rice Exports by Country (dollar value), Rice Imports by Country (dollar value), Crude Oil Exports by Country, Petroleum Gas Exports by Country and OPEC Countries Crude Oil Exports Sales Data
Research Sources:
Alibaba’s supplier information for rice. Accessed on October 5, 2026
Central Intelligence Agency, The World Factbook Field Listing: Agriculture – Products. Accessed on October 5, 2026
International Trade Centre, Trade Map. Accessed on October 5, 2026
Investopedia, Net Exports Definition. Accessed on October 5, 2026
OXFAM Research Reports, Cereal Secrets, pp 9-10. Accessed on October 5, 2026
Wikipedia, Rice. Accessed on October 5, 2026




















 English (US) ·
 French (CA) ·
 French (FR) ·