
PROTECT YOURSELF with Orgo-Life® QUANTUM TECHNOLOGY
Orgo-Life the new way to the future Advertising by Adpathway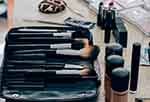 Cosmetics makeup kit
Beauty, cosmetics and skincare exports from all countries generated a total US$77.2 billion in 2025.
That dollar amount results from a 7.9% increase from $71.5 billion five years earlier in 2021.
Year over year, the total value of exported beauty, cosmetics and skincare goods gained 2.2% compared to $75.5 billion starting from 2024.
By value, the biggest 5 exporters of these specialized personal care commodities are France, South Korea, United States of America, Germany and mainland China. Collectively, that leading quintet of suppliers provided nearly half (48.3%) of globally exported beauty, cosmetics and skincare products.
From a continental perspective, European countries sold the highest dollar worth of exported beauty, cosmetics and skincare goods during 2025 with shipments from Europe valued at $39.6 billion or 51.3% of the global total. In second place were exporters located in Asia at 35.8% while another 10.2% of related shipments originated from North America.
Smaller percentages came from product shippers located in Africa (1%), Latin America (0.97%) excluding Mexico but including the Caribbean, then Oceania (0.7%) led by Australia and New Zealand.
For research purposes, the 4-digit Harmonized Tariff System code prefix is 3304 for beauty or makeup preparations and preparations for the care of the skin including sunscreen.
Below are the 25 countries that exported the highest dollar value worth of beauty, cosmetics and skincare products during 2025.
- France: US$12.5 billion (16.2% of total beauty/cosmetics exports)
- South Korea: $9.4 billion (12.2%)
- United States: $5.9 billion (7.6%)
- Germany: $5.1 billion (6.6%)
- mainland China: $4.4 billion (5.7%)
- Singapore: $4.3 billion (5.6%)
- Italy: $3.32 billion (4.3%)
- Hong Kong: $3.3 billion (4.3%)
- Poland: $3.17 billion (4.1%)
- Japan: $3.07 billion (4%)
- Spain: $2.3 billion (2.9%)
- Netherlands: $2.24 billion (2.9%)
- United Kingdom: $2.2 billion (2.9%)
- Belgium: $2 billion (2.5%)
- Canada: $1.5 billion (2%)
- Czech Republic: $1.3 billion (1.7%)
- Switzerland: $1.2 billion (1.6%)
- Thailand: $866.6 million (1.1%)
- Denmark: $680.6 million (0.9%)
- Sweden: $604 million (0.8%)
- Australia: $462.8 million (0.6%)
- Mexico: $442.6 million (0.6%)
- Austria: $424 million (0.5%)
- South Africa: $394.3 million (0.5%)
- Türkiye: $388.1 million (0.5%)
By value, the listed 25 countries shipped 92.6% of global beauty, cosmetics and skincare exports in 2025.
Among the top exporters, the fastest-growing suppliers from 2024 to 2025 were: Netherlands (up 25.8%), Denmark (up 20.1%), Spain (up 19.8%) and Poland (up 15.9%).
Those countries that posted year-over-year declines in their export sales were led by: Switzerland (down -15.4%), Singapore (down -12.6%), Australia (down -12.3%), Thailand (down -11.6%) and Canada (down -6.3%).
Top Beauty/Skincare Products Subcategories
Different types of beauty cosmetics and skincare exports are listed in descending order below, starting with the most lucrative subcategory.
- Beauty/makeup preparations and skincare: US$61.1 billion (up 2.1% from 2024)
- Lip makeup including lipstick: $6.3 billion (up 6%)
- Eye makeup: $5 billion (down -1.1%)
- Makeup or skincare powders: $3.1 billion (up 3.8%)
- Manicure or pedicure preparations: $1.65 billion (up 0.7%)
The sole decliner among the above product categories was eye makeup via its -1.1% slowdown.
Average Prices for Main Beauty, Cosmetics & Skincare Exporters
Based on an analysis of the major suppliers that report their specialized personal care exports priced in tons, listed below are average prices charged by 15 leading countries. They are ranked in descending order starting with exporters attracting the greatest total international sales.
- France: US$38,530 per ton of beauty/cosmetics exports (down -1.6% from 2024)
- South Korea: $31,942 per ton (down -2%)
- United States: $36,578 per ton (up 1.4%)
- Germany: $24,180 per ton (up 5.3%)
- mainland China: $10,231 per ton (down -13%)
- Singapore: $100,569 per ton (up 7.4%)
- Italy: $29,475 per ton (up 1.1%)
- Poland: $20,181 per ton (up 11.4%)
- Japan: $54,496 per ton (up 0.9%)
- Spain: $15,533 per ton (up 17.7%)
- Netherlands: $6,650 per ton (down -27.4%)
- United Kingdom: $29,855 per ton (up 5.1%)
- Belgium: $34,853 per ton (up 34.9%)
- Czech Republic: $43,431 per ton (up 3.4%)
- Switzerland: $73,750 per ton (up 5.8%)
Globally, the average unit price charged by all countries was $23,944 per ton deflating by -13.4% from $27,665 per ton for 2024.
Eleven among the above leading suppliers charged more than the worldwide average unit price.
In 2025, the lowest average unit prices for exported beauty, cosmetics and personal care products originate from the Netherlands ($6,650 per ton), mainland China ($10,321 per ton), Spain ($15,533 per ton) and Poland ($20,181).
The most expensive average prices are sourced from top suppliers in Singapore ($100,559 per ton), Switzerland ($73,750 per ton), Japan ($54,496 per ton) then the Czech Republic ($43,431 per ton).
Countries Generating Greatest Trade Surpluses from Specialized Personal Products
s
The following countries posted the highest positive net exports for beauty, cosmetics and skincare products during 2025. Investopedia defines net exports as the value of a country’s total exports minus the value of its total imports. Thus, the statistics below present the surplus between the value of each country’s exported beauty cosmetics and skincare items and its import purchases for those same commodities.
- France: US$9.4 billion (net export surplus down -1.1% since 2024)
- South Korea: $8.5 billion (up 10.5%)
- Singapore: $1.7 billion (down -22.2%)
- Italy: $1.4 billion (down -2.9%)
- Japan: $1.2 billion (up 24.1%)
- Germany: $1.1 billion (down -28.4%)
- Poland: $859.3 million (down -21.4%)
- Belgium: $587.7 million (up 557.3%)
- Switzerland: $407.7 million (down -42%)
- Ivory Coast: $252.6 million (up 30.2%)
- Spain: $197.2 million (down -20.9%)
- Czech Republic: $194.5 million (down -16.1%)
- Netherlands: $185.3 million (up 209.6%)
- South Africa: $124.1 million (up 19.3%)
- Denmark: $66.9 million (up 1382%)
A well-established fashion mecca, France earns the highest surplus in the international trade of beauty cosmetics and skincare offerings. In turn, this positive cashflow confirms France’s strong competitive advantage for this specific product category.
Countries Causing Worst Trade Deficits from Specialized Personal Products
The following countries posted the highest negative net exports for beauty cosmetics and skincare products during 2025. Investopedia defines net exports as the value of a country’s total exports minus the value of its total imports. Thus, the statistics below present the deficit between the value of each country’s import purchases and its exports for these specialized personal care commodities.
- mainland China: -US$8.3 billion (net export deficit down -6.9% since 2023)
- United States: -$1.6 billion (up 0.6%)
- United Arab Emirates: -$1.3 billion (reversing a $75.2 million surplus)
- Saudi Arabia: -$1.1 billion (up 0.8%)
- Russia: -$1 billion (up 8.1%)
- United Kingdom: -$993.9 million (up 7%)
- Vietnam: -$734.6 million (up 119.1%)
- Australia: -$733.8 million (up 18.3%)
- Mexico: -$660.2 million (up 13.7%)
- Taiwan: -$659.1 million (up 16.1%)
- Macao: -$626 million (down -45.3%)
- Hong Kong: -$592.8 million (down -10.8%)
- Norway: -$473.3 million (up 6.6%)
- Portugal: -$426.8 million (up 38.5%)
- Indonesia: -$419 million (up 25.6%)
Mainland China incurred the highest deficit in the international trade of beauty cosmetics and skincare products. In turn, this negative cashflow highlights the Asian entity’s strong competitive disadvantage for this specific product category but also signals opportunities for supplying countries positioned to satisfy the powerful demand among Chinese consumers and businesses.
Major Beauty, Cosmetics & Skincare Companies
Below are global conglomerates that represent established players engaged in the international trade of beauty, cosmetics and skincare offerings. Each conglomerate’s home country is shown within parenthesis.
- Avon Products (United States)
- L’Oreal (France)
- Proctor & Gamble (United States)
- Shiseido (Japan)
- Unilever (United Kingdom)
See also Beauty Cosmetics and Skincare Imports by Country, Perfumes Exporters by Country, Diamond Exports by Country, Wine Exports by Country and France’s Top 10 Exports
Research Sources:
Central Intelligence Agency, The World Factbook Field Listing: Exports – Commodities. Accessed on June 5, 2026
International Trade Centre, Trade Map. Accessed on June 5, 2026
Investopedia, Net Exports Definition. Accessed on June 5, 2026
Wikipedia, Cosmetics. Accessed on June 5, 2026
Wikipedia, Category:Cosmetics companies. Accessed on June 5, 2026


 English (US) ·
  French (CA) ·
  French (FR) ·