

 1 week ago
9
PROTECT YOURSELF with Orgo-Life® QUANTUM TECHNOLOGY
Orgo-Life the new way to the future Advertising by Adpathway Portugal (FlagPictures)
Located along southwestern Europe’s coastline, Portugal’s imported products cost US$126.1 billion in 2025.
That dollar amount results from a 28.2% increase in Portuguese spending compared to $98.3 billion 5 years earlier during 2021, and a 12.2% year-over-year acceleration compared to $98.3 billion starting from 2024.
Based on the average exchange rate for 2025, Portugal uses the euro which strengthened via a 4.4% gain against the US dollar from 2024 to 2025. The stronger European Union currency in 2025 made exports into Portugal less expensive when converted to American dollars starting from euros.
Domestically, the inflation rate for Portugal’s consumer prices averaged 1.949% in 2025 down from an average 2.67% for 2024.
Portugal’s Best International Trade Suppliers
The latest available country-specific data shows that 82.2% of products imported into Portugal was supplied by exporters in: Spain (32.8% of the Portuguese total), Germany (11.9%), France (7.3%), Netherlands (6%), mainland China (5.3%), Italy (5%), Belgium (3.3%), Ireland (2.9%), Brazil (2.4%), United States of America (2.1%), Poland (1.8%) and Türkiye (1.5%).
Applying a continental lens, more than three-quarters (78.6%) of Portugal’s total imports by value in 2025 were purchased from fellow European countries. Note that over three-quarters (76.5%) originated from fellow European Union member countries.
Trade partners located in Asia satisfied 12.2% of Portugal’s spending on imported products.
Smaller percentages came from suppliers in Africa (3.4%), Latin America (3.2%) excluding Mexico but including the Caribbean, North America (2.5%), then Oceania (0.1%) led by Australia, New Zealand and Papua New Guinea.
Given Portugal’s population of 10.7 million people, its total US$126.1 billion in 2025 imports translates to roughly $11,750 in yearly product demand from every person in the southwest European country. That per-capita metric exceeds the average $10,900 for 2024.
The following product groups represent the highest dollar value in Portugal’s import purchases during 2025. Also shown is the percentage share each product category represents in terms of overall imports into Portugal.
- Vehicles: US$16 billion (12.7% of total imports)
- Electrical machinery, equipment: $11.6 billion (9.2%)
- Machinery including computers: $11.3 billion (9%)
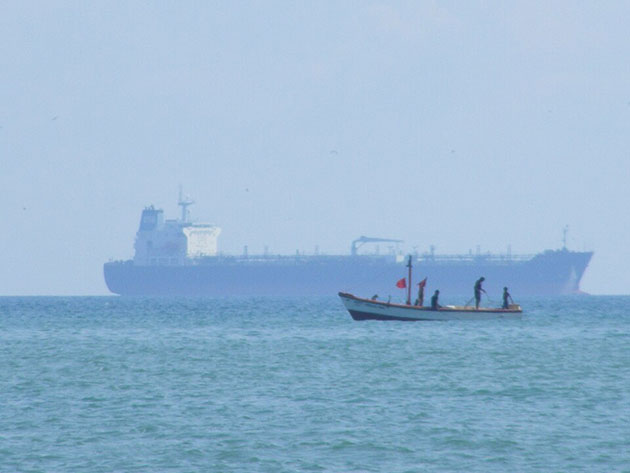
- Mineral fuels including oil: $10.7 billion (8.5%)
- Organic chemicals: $5.6 billion (4.5%)
- Plastics, plastic articles: $5.4 billion (4.3%)
- Pharmaceuticals: $4.9 billion (3.8%)
- Iron, steel: $3.9 billion (3.1%)
- Optical, technical, medical apparatus: $3 billion (2.4%)
- Fish: $2.9 billion (2.3%)
Portugal’s top 10 import product categories generated nearly three-fifths (59.7%) of the overall value of imported products purchased from other countries.
The greatest increases among the leading product categories belong to Portuguese imports of organic chemicals (up 55.3% from 2024), vehicles (up 20.8%), fish (up 18.4%) then pharmaceuticals (up 18.3%).
The lone year-over-year decline was the -11.9% downturn for Portugal’s imports of mineral fuels including oil. Historically, the biggest reductions are for imported petroleum gases, crude oil and processed petroleum oils.
Please note that the results listed above are at the 2-digit Harmonized Tariff System code level. Information at the more detailed 4-digit level is presented in the sections below.
Portugal’s Most Valuable Vehicles Imports
In 2025, Portuguese importers spent the most on the following 10 subcategories of vehicles.
- Cars: US$8.9 billion (up 26.1% from 2024)
- Automobile parts/accessories: $4 billion (up 14.8%)
- Trucks: $1.1 billion (up 21.9%)
- Tractors: $589.3 million (down -5.1%)
- Motorcycle parts/accessories: $429.6 million (up 26.1%)
- Motorcycles: $298.8 million (up 17.7%)
- Public-transport vehicles: $241 million (up 48.6%)
- Trailers: $211.9 million (up 18.3%)
- Special purpose vehicles: $73.8 million (down -14.9%)
- Bicycles, other non-motorized cycles: $51.6 million (up 25.4%)
Among these import subcategories, Portuguese purchases of public-transport vehicles (up 48.6%), cars (up 26.1%) then motorcycle parts or accessories (up 26.1%) grew at the fastest pace from 2024 to 2025.
These amounts and the percentage gains within parenthesis clearly show where the strongest demand lies for different types of vehicles-related imports among Portuguese businesses and consumers.
Portugal’s Most Valuable Electronics Imports
In 2025, Portuguese importers spent the most on the following 10 subcategories of electrical goods including consumer electronics.
- Integrated circuits/microassemblies: US$2 billion (up 16.7% from 2024)
- Phone devices including smartphones: $1.7 billion (up 8.2%)
- Insulated wire/cable: $763.7 million (up 15.4%)
- Solar power diodes/semi-conductors: $669.3 million (down -30%)
- Lower-voltage switches, fuses: $612.7 million (up 12%)
- Electrical converters/power units: $575.2 million (up 32.1%)
- Electric water heaters, hair dryers: $493.5 million (up 13.3%)
- TV receivers/monitors/projectors: $416.3 million (up 12.1%)
- Electric storage batteries: $366.8 million (up 32.3%)
- Flat panel displays: $312.9 million (down -3%)
Among these import subcategories, Portuguese purchases of electric storage batteries (up 32.3%), electrical converters or power units (up 32.1%) then integrated circuits and microassemblies (up 16.7%) grew at the fastest pace from 2024 to 2025.
These amounts and the percentage gains within parenthesis clearly show where the strongest demand lies for different types of electronics-related imports among Portuguese businesses and consumers.
Portugal’s Most Valuable Machinery Imports Including Computers
In 2025, Portuguese importers spent the most on the following 10 subcategories of machinery including computers.
- Computers, optical readers: US$1.2 billion (up 7.4% from 2024)
- Piston engines: $659.1 million (up 13.9%)
- Air conditioners: $584.2 million (up 26%)
- Taps, valves, similar appliances: $503.3 million (up 13.7%)
- Miscellaneous machinery: $481.6 million (up 6.6%)
- Refrigerators, freezers: $473.7 million (up 10.3%)
- Air or vacuum pumps: $416.9 million (up 24.2%)
- Centrifuges, filters and purifiers: $401.6 million (up 11.4%)
- Turbo-jets: $390.6 million (up 54.5%)
- Piston engine parts: $358.7 million (up 5.7%)
Among these import subcategories, Portuguese purchases of turbo-jets (up 54.5%), air conditioners (up 26%) then air or vacuum pumps (up 24.2%) grew at the fastest pace from 2024 to 2025.
These amounts and the percentage gains within parenthesis clearly show where the strongest demand lies for different types of machinery-related imports among Portuguese businesses and consumers.
Portugal’s Most Valuable Mineral Fuels Imports Including Oil
In 2025, Portuguese importers spent the most on the following 10 subcategories of mineral fuels-related products.
- Crude oil: US$4.5 billion (down -29.3% from 2024)
- Processed petroleum oils: $3.1 billion (up 17.4%)
- Petroleum gases: $1.7 billion (down -0.4%)
- Electrical energy: $1 billion (down -4.6%)
- Petroleum oil residues: $158.5 million (up 4.7%)
- Coal tar oils (high temperature distillation): $101.5 million (up 19.6%)
- Petroleum jelly, mineral waxes: $30.4 million (up 24.8%)
- Asphalt/petroleum bitumen mixes: $10.1 million (up 37.8%)
- Peat: $9.1 million (down -22.9%)
- Coke, semi-coke: $6.2 million (up 14.3%)
Among these import subcategories, Portuguese purchases of asphalt or petroleum bitumen mixes (up 37.8%), petroleum jelly and mineral waxes (up 24.8%) then high-temperature distilled coal tar oils (up 19.6%) grew at the fastest pace from 2024 to 2025.
These amounts and the percentage changes within parenthesis clearly show where the strongest demand lies for different types of mineral fuels-related imports among Portuguese businesses and consumers.
See also Portugal’s Top Trading Partners, Portugal’s Top 10 Exports, France’s Top Trading Partners, France’s Top 10 Exports
Research Sources:
Central Intelligence Agency, The World Factbook: Country Profiles. Accessed on October 9, 2026
International Monetary Fund, Exchange Rates selected indicators (Domestic Currency per U.S. dollar, period average). Accessed on October 9, 2026
International Monetary Fund, World Economic Outlook Database (GDP based on Purchasing Power Parity). Accessed on October 9, 2026
International Trade Centre, Trade Map. Accessed on October 9, 2026






















 English (US) ·
 French (CA) ·
 French (FR) ·