

 1 month ago
7
PROTECT YOURSELF with Orgo-Life® QUANTUM TECHNOLOGY
Orgo-Life the new way to the future Advertising by Adpathway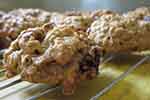 Oatmeal raisin
Worldwide, cookies exported by country totaled US$13.9 billion in 2025.
That dollar amount results from an average 43.6% increase for all international sellers of cookies over the 5-year period starting in 2021 when total sweet biscuit exports were worth $9.7 billion.
Year over year, the value of exported cookies accelerated by 10.2% compared to $12.6 billion starting from 2024.
Also called sweet biscuits in some countries, a wide range of cookies are beloved snacks around the globe. In the United States, favorites include chocolate chip, peanut butter, oatmeal raisin, white chocolate, sugar and shortbread cookies according to OnePoll.com.
The 5 biggest cookie exporters are Mexico, Netherlands, Germany, Belgium and Italy. Combined, that quintet of major suppliers generated just over two-fifths (40.5%) of the overall value of globally exported cookies during 2025.
Among continents, European countries sold the highest dollar worth of exported cookies during 2025 with shipments valued at $8.1 billion or 58.3% of the worldwide total. In second place were exporters based in Asia up 17.9% while another 15.9% of cookie shipments originated from North America.
Smaller percentages came from providers in Latin America (4%) excluding Mexico but including the Caribbean, Africa (3%), Oceania (0.9%) led by Australia, New Zealand and Fiji.
For research purposes, the 6-digit Harmonized Tariff System code prefix for sweet biscuits is 190531.
Below are the 15 countries that exported the highest dollar value worth of cookies during 2025.
- Mexico: US$1.33 billion (9.6% of total exported cookies)
- Netherlands: $1.28 billion (9.2%)
- Germany: $1.23 billion (8.9%)
- Belgium: $975.3 million (7%)
- Italy: $809.1 million (5.8%)
- Canada: $596.5 million (4.3%)
- United Kingdom: $531.9 million (3.8%)
- France: $519.1 million (3.7%)
- Poland: $511.9 million (3.7%)
- Türkiye: $510.4 million (3.7%)
- Spain: $494.2 million (3.6%)
- Indonesia: $462.6 million (3.3%)
- India: $417.4 million (3%)
- Czech Republic: $329.5 million (2.4%)
- United States: $277.3 million (2%)
By value, the listed 15 countries shipped almost three-quarters (74%) of all cookies exported in 2025.
Among the top exporters, the fastest-growing cookies exporters since 2024 were: Italy (up 24.6%), Spain (up 20.8%), Belgium (up 19.6%) and India (up 19.6%).
Major suppliers that posted the most modest year-over-year gains in their exported cookies sales were led by: Mexico (up 0.4% from 2024), United States of America (up 1.8%) and Türkiye (up 3.5%).
Searchable Database of Cookies Exporting Countries in 2025
The following automated database of major international suppliers collected 99.9% of the overall revenues from globally exported sweet biscuits.
| 1 | Mexico | $1,325,248,000 | +0.4% |
| 2 | Netherlands | $1,275,496,000 | +16.1% |
| 3 | Germany | $1,233,045,000 | +12.6% |
| 4 | Belgium | $975,270,000 | +19.6% |
| 5 | Italy | $809,079,000 | +24.6% |
| 6 | Canada | $596,480,000 | +6.7% |
| 7 | United Kingdom | $531,921,000 | +9.3% |
| 8 | France | $519,132,000 | +8.6% |
| 9 | Poland | $511,919,000 | +12.1% |
| 10 | Türkiye | $510,449,000 | +3.5% |
| 11 | Spain | $494,195,000 | +20.8% |
| 12 | Indonesia | $462,624,000 | +4.2% |
| 13 | India | $417,376,000 | +19.6% |
| 14 | Czech Republic | $329,466,000 | +11.5% |
| 15 | United States | $277,334,000 | +1.8% |
| 16 | Denmark | $237,432,000 | +6.6% |
| 17 | Malaysia | $194,727,000 | +5.1% |
| 18 | Egypt | $151,280,000 | +118.1% |
| 19 | Thailand | $148,265,000 | +15.2% |
| 20 | Sweden | $144,582,000 | +14.8% |
| 21 | mainland China | $138,181,000 | +22.4% |
| 22 | Austria | $133,332,000 | +8.6% |
| 23 | Russia | $131,754,000 | -4.4% |
| 24 | Peru | $110,935,000 | +1.2% |
| 25 | Zambia | $108,437,000 | +51.8% |
| 26 | Ukraine | $105,280,000 | +40.1% |
| 27 | Serbia | $104,873,000 | +20.8% |
| 28 | Saudi Arabia | $93,842,000 | +6.3% |
| 29 | Australia | $75,027,000 | +10.7% |
| 30 | South Africa | $73,666,000 | +16.6% |
| 31 | Costa Rica | $68,655,000 | -3.5% |
| 32 | Guatemala | $66,341,000 | -0.6% |
| 33 | Brazil | $64,243,000 | +6.4% |
| 34 | Latvia | $63,142,000 | +14.8% |
| 35 | Oman | $61,887,000 | +7.8% |
| 36 | Croatia | $60,558,000 | +9.3% |
| 37 | Romania | $58,601,000 | +25% |
| 38 | Bahrain | $57,123,000 | -31.8% |
| 39 | Portugal | $54,673,000 | +14.2% |
| 40 | Singapore | $50,865,000 | -10.1% |
| 41 | Hong Kong | $47,470,000 | -27.4% |
| 42 | Pakistan | $45,143,000 | +9.3% |
| 43 | Bulgaria | $44,783,000 | +31.1% |
| 44 | New Zealand | $44,406,000 | +36.8% |
| 45 | Argentina | $43,734,000 | +23% |
| 46 | Kazakhstan | $36,101,000 | +27.8% |
| 47 | Greece | $35,189,000 | +23.7% |
| 48 | Philippines | $31,990,000 | -15.7% |
| 49 | El Salvador | $31,890,000 | +4% |
| 50 | Slovenia | $31,182,000 | +66.2% |
| 51 | Colombia | $28,833,000 | -2.2% |
| 52 | Bosnia/Herzegovina | $28,752,000 | +1.1% |
| 53 | Hungary | $27,799,000 | -4.9% |
| 54 | Dominican Republic | $27,396,000 | -12.4% |
| 55 | Ireland | $26,988,000 | +3.1% |
| 56 | Switzerland | $26,638,000 | +3.5% |
| 57 | Bangladesh | $26,000,000 | -3.1% |
| 58 | Uganda | $25,992,000 | +148.2% |
| 59 | Slovakia | $25,091,000 | +6.1% |
| 60 | Trinidad/Tobago | $24,832,000 | +11% |
| 61 | Lithuania | $24,827,000 | +11.4% |
| 62 | United Arab Emirates | $22,313,000 | -71.8% |
| 63 | South Korea | $21,903,000 | -7.1% |
| 64 | Vietnam | $20,520,000 | -1.5% |
| 65 | Sri Lanka | $19,369,000 | -5% |
| 66 | Panama | $18,603,000 | +2.9% |
| 67 | North Macedonia | $18,202,000 | -8.3% |
| 68 | Ecuador | $17,870,000 | +20% |
| 69 | Morocco | $15,919,000 | +47.7% |
| 70 | Barbados | $15,666,000 | +10.5% |
| 71 | Honduras | $14,945,000 | +209.8% |
| 72 | Uzbekistan | $14,545,000 | -16.8% |
| 73 | Iran | $14,148,000 | -22.9% |
| 74 | Taiwan | $13,517,000 | -26.4% |
| 75 | Japan | $11,571,000 | -15.2% |
| 76 | Moldova | $9,121,000 | -13.7% |
| 77 | Jordan | $8,633,000 | -34.6% |
| 78 | Rwanda | $7,853,000 | -4% |
| 79 | Chile | $7,824,000 | +9.4% |
| 80 | Syria | $7,285,000 | -9.4% |
| 81 | Finland | $7,158,000 | +37.9% |
| 82 | Kenya | $6,201,000 | +24.6% |
| 83 | Ghana | $6,015,000 | -36.8% |
| 84 | Tunisia | $5,410,000 | -74.2% |
| 85 | Luxembourg | $4,225,000 | +3% |
| 86 | Kyrgyzstan | $3,914,000 | +30.9% |
| 87 | Senegal | $3,871,000 | +17.4% |
| 88 | Estonia | $3,408,000 | +48.7% |
| 89 | Zimbabwe | $2,768,000 | -28.2% |
| 90 | Lesotho | $2,735,000 | +9.2% |
| 91 | Paraguay | $2,724,000 | +101.6% |
| 92 | Jamaica | $2,610,000 | -29.6% |
| 93 | Bolivia | $2,300,000 | +16.1% |
| 94 | Algeria | $2,222,000 | -79.5% |
| 95 | Norway | $1,972,000 | +18.4% |
| 96 | Lebanon | $1,862,000 | -71.8% |
| 97 | Venezuela | $1,853,000 | -15.5% |
| 98 | Azerbaijan | $1,821,000 | +52.1% |
| 99 | Macao | $1,777,000 | +191.8% |
| 100 | Nigeria | $1,767,000 | +29% |
Focusing on the leading 100 cookie suppliers, the fastest growers were the Honduras (up 209.8% from 2024), Macao (up 191.8%), Uganda (up 148.2%), Egypt (up 118.1%) then Paraguay (up 101.6%).
You can change the presentation order by clicking the triangle icon at the top of the above table’s columns. An entry of 0% in the right-most column means that 2024 data was unavailable.
Countries Enjoying Best Trade Surpluses from Cookies
The following countries posted the highest positive net exports for cookies during 2025. Investopedia defines net exports as the value of a country’s total exports minus the value of its total imports. Thus, the statistics below present the surplus between the value of each country’s exported cookies and its import purchases for that same commodity.
- Mexico: US$1.2 billion (net export surplus up 0.9% since 2024)
- Netherlands: $717.4 million (up 12.7%)
- Italy: $502.1 million (up 32.3%)
- Belgium: $475 million (up 19.1%)
- Türkiye: $463.4 million (up 2.1%)
- Indonesia: $425.2 million (up 4.3%)
- Germany: $421.5 million (down -0.2%)
- India: $404.7 million (up 20.9%)
- Poland: $321.8 million (up 10.3%)
- Spain: $257.9 million (up 25.2%)
- Czech Republic: $235.9 million (up 9.7%)
- Canada: $228.3 million (up 7.6%)
- Denmark: $155.7 million (up 2.5%)
- Egypt: $137.3 million (up 125.3%)
- Zambia: $102.1 million (up 55%)
World-leading cookie seller Mexico generated the highest surplus in the international trade of cookies. In turn, this positive cashflow confirms strong Mexican competitive advantages for this specific product category.
Countries Incurring Worst Trade Deficits from Cookies
The following countries posted the highest negative net exports for cookies during 2025. Investopedia defines net exports as the value of a country’s total exports minus the value of its total imports. Thus, the statistics below present the deficit between the value of each country’s imported cookies purchases and its exports for that same commodity.
- United States: -US$2.2 billion (net export deficit up 3.3% since 2024)
- United Kingdom: -$299.1 million (up 6.9%)
- France: -$291.5 million (up 54.9%)
- Ireland: -$222.7 million (up 16.8%)
- Iraq: -$187.1 million (up 7.9%)
- mainland China: -$138.1 million (down -14.9%)
- United Arab Emirates: -$128.7 million (up 53.1%)
- Portugal: -$124.5 million (up 8.4%)
- Saudi Arabia: -$118.2 million (up 0.4%)
- Australia: -$114.3 million (down -8.6%)
- Romania: -$92.5 million (down -8.3%)
- Vietnam: -$91.3 million (up 2.5%)
- Switzerland: -$78.2 million (up 21.3%)
- Yemen: -$77.4 million (up 65.7%)
- Israel: -$73.2 million (up 16.8%)
The United States of America incurred the highest deficit in the international trade of cookies. In turn, this negative cashflow highlights America’s competitive disadvantage for this specific product category but also signals opportunities for cookies-supplying countries that help satisfy the powerful consumer demand.
Cookies Exporting Companies
According to global trading platform Alibaba, the following suppliers are examples of cookies-trading exporters. The home-country location for each business is shown within parentheses.
- Benfel Dis Ticaret Limited Sirketi (Turkey)
- Blue Dots SRO (Czech Republic)
- Dollaritemdirect.com Inc (United States)
- Gusti d’Italia SRL (Italy)
- Jens Schleicher GMBH (Germany)
- LA International Trading Ltd (United Kingdom)
- NV Solucious (Belgium)
- Petitki (Poland)
- Pt. Agel Langgeng (Indonesia)
- RYS Trading Company BV (Netherlands)
See also Chocolate Exporters by Country, Candy Sweets Exports by Country , Soft Drinks Exporters by Country and Ice Cream Exporters by Country
Research Sources:
Alibaba, Product showroom for cookies. Accessed on September 19, 2026
Central Intelligence Agency, The World Factbook. Field Listing: Exports – Commodities. Accessed on September 19, 2026
Forbes Global 2000 rankings, The World’s Biggest Public Companies. Accessed on September 19, 2026
Huffington Post, The Definitive List of America’s Favorite Cookies. Accessed on September 19, 2026
International Trade Centre, Trade Map. Accessed on September 19, 2026
Investopedia, Net Exports Definition. Accessed on September 19, 2026
Wikipedia, Cookie. Accessed on September 19, 2026




















 English (US) ·
 French (CA) ·
 French (FR) ·