

 3 days ago
4
3 days ago
4
PROTECT YOURSELF with Orgo-Life® QUANTUM TECHNOLOGY
Orgo-Life the new way to the future Advertising by Adpathway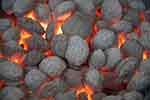 Charcoal for BBQ (Pixabay)
Globally, wood charcoal exported from all countries totaled US$1.53 billion in 2025.
That dollar amount reflects an average 18.1% increase for all charcoal shippers from $1.44 billion five years earlier in 2021.
Year over year, the value of globally exported charcoal accelerated by 13.1% compared to $1.51 billion starting from 2024.
Light gray in color, charcoal results from the slow heating of wood or other combustible substances in an oxygen-less environment. This process contrasts with the millions of years involved for coal, a black natural mineral and fossil fuel formed under the earth’s crust under high temperature and intense pressure.
Other differences are that charcoal produces more heat and is a cleaner fuel than coal. In addition to generating energy and producing heat for cooking, black powder from charcoal is used in creating purification filters as well as producing fireworks.
The 5 biggest exporters of wood charcoal by sales are Indonesia, Laos, Philippines, Vietnam, mainland China and Ukraine. Combined, that quintet of leading charcoal exporters collected approaching half (47.9%) of revenues from globally exported wood charcoal in 2025.
Among continents, suppliers based in Asia exported the highest dollar worth of charcoal during 2025 with shipments valued at $952.2 million or 55.9% of the global total. In second place were exporters in Europe at 21.3% while another 11.1% of worldwide charcoal shipments originated from Africa.
Smaller percentages came from sellers in Latin America (8%) excluding Mexico but including the Caribbean, North America (3.6%), and Oceania (0.05%) led by Australia and Fiji.
For research purposes, the 4-digit Harmonized Tariff System code prefix is 4402 for wood charcoal.
Below are the 15 countries that exported the highest dollar value worth of charcoal during 2025.
- Indonesia: US$428.7 million (25.2% of total charcoal exports)
- Philippines: $126.7 million (7.4%)
- Vietnam: $93.5 million (5.5%)
- China: $84.4 million (5%)
- Ukraine: $83.8 million (4.9%)
- Poland: $74.1 million (4.4%)
- Laos: $70.7 million (4.1%)
- Namibia: $70.1 million (4.1%)
- Nigeria: $64.7 million (3.8%)
- Paraguay: $49.7 million (2.9%)
- India: $45.1 million (2.6%)
- Cuba: $44.5 million (2.6%)
- Mexico: $40.3 million (2.4%)
- Myanmar: $37.7 million (2.2%)
- Netherlands: $35.1 million (2.1%)
By value, the listed 15 countries shipped nearly four-fifths (79.2%) of globally exported charcoal in 2025.
Among the top exporters, the fastest-growing charcoal exporters since 2024 were: Myanmar (up 34,215%), Nigeria (up 3,481%), Philippines (up 50.3%) and Mexico (up 40.5%).
Those listed countries that posted declines in their exported charcoal sales were: Laos (down -30.9% from 2024), Netherlands (down -22.1%), Cuba (down -8.4%), Paraguay (down -7.6%) and Poland (down -4.1%).
Accounting for 99.99% of globally exported charcoal in 2025, the 100 key suppliers of wood charcoal on international markets are highlighted in the following automated database.
| 1 | Indonesia | $428,673,000 | +22% |
| 2 | Philippines | $126,673,000 | +50.3% |
| 3 | Vietnam | $93,527,000 | +3.8% |
| 4 | China | $84,433,000 | +5.1% |
| 5 | Ukraine | $83,765,000 | +6.3% |
| 6 | Poland | $74,136,000 | -4.1% |
| 7 | Laos | $70,710,000 | -30.9% |
| 8 | Namibia | $70,131,000 | +2% |
| 9 | Nigeria | $64,677,000 | +3481% |
| 10 | Paraguay | $49,666,000 | -7.6% |
| 11 | India | $45,051,000 | +14.4% |
| 12 | Cuba | $44,513,000 | -8.4% |
| 13 | Mexico | $40,318,000 | +40.5% |
| 14 | Myanmar | $37,746,000 | +34215% |
| 15 | Netherlands | $35,088,000 | -22.1% |
| 16 | Germany | $34,884,000 | +10.6% |
| 17 | South Africa | $34,651,000 | +71.3% |
| 18 | Spain | $27,329,000 | +24.5% |
| 19 | Malaysia | $22,555,000 | -0.2% |
| 20 | Portugal | $20,918,000 | +14.9% |
| 21 | United States | $19,462,000 | +9.3% |
| 22 | Belgium | $16,903,000 | +16.5% |
| 23 | Argentina | $16,682,000 | +55.7% |
| 24 | Thailand | $15,690,000 | +76.3% |
| 25 | Egypt | $13,502,000 | -17.5% |
| 26 | Russia | $12,466,000 | +29.9% |
| 27 | Sri Lanka | $8,385,000 | +21% |
| 28 | Venezuela | $8,259,000 | -18.7% |
| 29 | Bosnia/Herzegovina | $7,835,000 | -21.4% |
| 30 | Bangladesh | $7,674,000 | -48.1% |
| 31 | France | $7,046,000 | -56.1% |
| 32 | Croatia | $6,835,000 | +13.3% |
| 33 | Latvia | $6,604,000 | +1.7% |
| 34 | Türkiye | $6,413,000 | -19.1% |
| 35 | Bolivia | $5,561,000 | +19.4% |
| 36 | Slovakia | $4,873,000 | -2.6% |
| 37 | Denmark | $4,784,000 | +11.8% |
| 38 | Brazil | $3,994,000 | +0.4% |
| 39 | United Kingdom | $3,577,000 | +18% |
| 40 | Colombia | $3,538,000 | -12.5% |
| 41 | South Sudan | $3,460,000 | +94.1% |
| 42 | Serbia | $2,705,000 | -2.9% |
| 43 | Lithuania | $2,101,000 | -2.5% |
| 44 | Italy | $2,002,000 | +2.1% |
| 45 | Greece | $1,776,000 | -10.5% |
| 46 | Nicaragua | $1,736,000 | +87.7% |
| 47 | Canada | $1,491,000 | -17.1% |
| 48 | Japan | $1,210,000 | -24.6% |
| 49 | Ghana | $1,175,000 | +216.7% |
| 50 | Tanzania | $1,018,000 | +4748% |
| 51 | Hungary | $977,000 | -7.6% |
| 52 | Sweden | $954,000 | -69.5% |
| 53 | Slovenia | $953,000 | -26.5% |
| 54 | El Salvador | $880,000 | -34% |
| 55 | Romania | $769,000 | -21.6% |
| 56 | Ireland | $750,000 | +172.7% |
| 57 | Dominican Republic | $735,000 | +3.7% |
| 58 | Austria | $713,000 | +8.5% |
| 59 | Australia | $673,000 | -20.6% |
| 60 | United Arab Emirates | $652,000 | -95% |
| 61 | Norway | $641,000 | -89.5% |
| 62 | Switzerland | $576,000 | -21.7% |
| 63 | Estonia | $526,000 | +3.3% |
| 64 | Iran | $511,000 | -0.2% |
| 65 | Czech Republic | $412,000 | +4.6% |
| 66 | Angola | $412,000 | +8.7% |
| 67 | Taiwan | $400,000 | -5% |
| 68 | Bhutan | $377,000 | -66.4% |
| 69 | Finland | $316,000 | -10.2% |
| 70 | South Korea | $299,000 | -12.1% |
| 71 | Saudi Arabia | $298,000 | +803% |
| 72 | Ivory Coast | $298,000 | +23.7% |
| 73 | Kazakhstan | $291,000 | -42.5% |
| 74 | Panama | $282,000 | -36.9% |
| 75 | Hong Kong | $238,000 | +38.4% |
| 76 | Guyana | $198,000 | -22% |
| 77 | Luxembourg | $188,000 | +44.6% |
| 78 | Sudan | $186,000 | -84.6% |
| 79 | Kenya | $166,000 | +937.5% |
| 80 | Singapore | $149,000 | +98.7% |
| 81 | Moldova | $117,000 | +23.2% |
| 82 | Guatemala | $81,000 | +285.7% |
| 83 | Bulgaria | $76,000 | -47.2% |
| 84 | Honduras | $70,000 | 0% |
| 85 | Fiji | $61,000 | -86.1% |
| 86 | Jordan | $52,000 | -80.7% |
| 87 | Tunisia | $52,000 | -82.7% |
| 88 | Curaçao | $47,000 | 0% |
| 89 | Oman | $46,000 | -28.1% |
| 90 | Chile | $44,000 | +69.2% |
| 91 | Eswatini | $35,000 | -52.1% |
| 92 | Lebanon | $34,000 | -64.6% |
| 93 | Senegal | $28,000 | +133.3% |
| 94 | New Zealand | $26,000 | +225% |
| 95 | Papua New Guinea | $26,000 | 0% |
| 96 | Somalia | $25,000 | -98% |
| 97 | Azerbaijan | $22,000 | +214.3% |
| 98 | Cyprus | $20,000 | 0% |
| 99 | Belarus | $19,000 | -48.6% |
| 100 | Georgia | $18,000 | +38.5% |
Focusing on the 100 major exporters, the fastest-growing sellers of charcoal on international markets are located in Myanmar sometimes called Burma (up 34,215% from 2024), Tanzania (up 4,748%), Nigeria (up 3,481%), Kenya (up 937.5%) then Saudi Arabia (up 803%).
You can change the presentation order by clicking the triangle icon at the top of the above table’s columns. An entry of 0% in the right-most column means that 2024 data was unavailable.
Countries Generating Best Trade Surpluses from Charcoal
The following countries posted the highest positive net exports for charcoal during 2025. Investopedia defines net exports as the value of a country’s total exports minus the value of its total imports. Thus, the statistics below present the surplus between the value of each country’s exported charcoal and its import purchases for that same commodity.
- Indonesia: US$427.7 million (net export surplus up 22% since 2024)
- Philippines: $126.5 million (up 50.2%)
- Vietnam: $90 million (up 3.8%)
- Ukraine: $82.7 million (up 7.3%)
- Laos: $70.7 million (down -30.9%)
- Namibia: $69.5 million (up 1.3%)
- Nigeria: $64.5 million (up 3783.9%)
- Paraguay: $49.6 million (down -7.4%)
- Cuba: $44.5 million (down -8.4%)
- Mexico: $39.8 million (up 42.2%)
- Myanmar: $37.5 million (up 34293.6%)
- Poland: $30.1 million (down -14.4%)
- India: $17.5 million (down -49.2%)
- Argentina: $16.6 million (up 55.3%)
- South Africa: $15.6 million (up 569.2%)
World-leading wood charcoal supplier Indonesia generated the highest surplus in the international trade of charcoal. In turn, this positive cashflow confirms strong Indonesian competitive advantages for this specific product category.
Countries Experiencing Worst Trade Deficits from Charcoal
The following countries posted the highest negative net exports for charcoal during 2025. Investopedia defines net exports as the value of a country’s total exports minus the value of its total imports. Thus, the statistics below present the deficit between the value of each country’s imported charcoal purchases and its exports for that same commodity.
- Japan: -US$127.6 million (net export deficit up 6.2% since 2024)
- Saudi Arabia: -$126.7 million (up 1.8%)
- South Korea: -$104.7 million (down -11.5%)
- United States: -$95.7 million (down -2.8%)
- mainland China: -$79.9 million (down -29.7%)
- Iraq: -$65.8 million (up 14.9%)
- United Kingdom: -$59.2 million (up 0.3%)
- France: -$51.3 million (up 17.2%)
- Türkiye: -$43.9 million (up 54.3%)
- Germany: -$43.1 million (down -9.6%)
- Norway: -$37.8 million (up 61.4%)
- Greece: -$34.7 million (up 1.5%)
- Italy: -$34.7 million (up 7.4%)
- Lebanon: -$33.8 million (up 7.9%)
- Bhutan: -$33.1 million (up 8.6%)
Japan and Saudi Arabia incurred the highest deficits in the international trade of charcoal. In turn, these negative cashflows highlight both countries’ competitive disadvantages for this specific product category but also signals opportunities for charcoal-supplying countries that help satisfy the powerful demand.
Charcoal Exporting Companies
The following suppliers are examples of charcoal-trading exporters.
- Basques Hardwood Charcoal (Canada)
- Dolimex SRL (Paraguay)
- HBE Trading (Netherlands)
- Jiangshan Luyi Bamboo Charcoal Co (China)
- Kim Ban Marketing (Malaysia)
- Sumber Jaya (Indonesia)
- UA Wood LLC (Ukraine)
- Vietgo Company Limited (Vietnam)
The home-country location for each business is shown within parentheses.
See also Sawn Wood Exports by Country, Coal Exports by Country, Electricity Exports by Country, Crude Oil Exports by Country and Top Sand Exporters by Country
Research Sources:
Alibaba, Product showroom for charcoal. Accessed on July 22, 2026
Central Intelligence Agency, The World Factbook Field Listing: Exports – Commodities. Accessed on July 22, 2026
Forbes Global 2000 rankings, The World’s Biggest Public Companies. Accessed on July 22, 2026
Investopedia, Net Exports Definition. Accessed on July 22, 2026
Patel Vidhu, 6 Differences Between Coal and Charcoal. Accessed on July 22, 2026
Trade Map, International Trade Centre. Accessed on July 22, 2026
Wikipedia, Charcoal. Accessed on July 22, 2026




















 English (US) ·
  French (CA) ·
  French (FR) ·